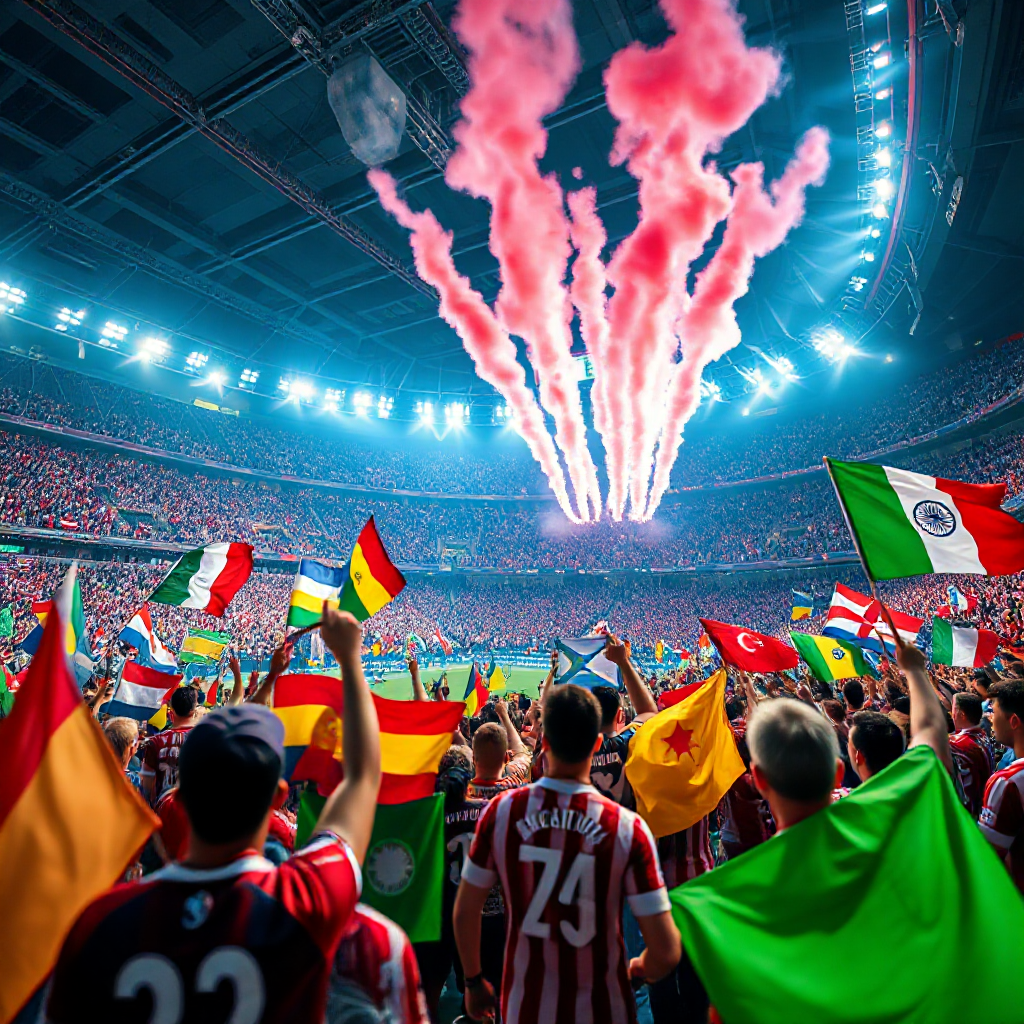

Borussia Dortmund Relies On Home Atmosphere To Drive Performance: A Structured Review
The premise that Borussia Dortmund relies on home atmosphere to drive performance holds structural merit, but it functions as a catalyst rather than a standalone tactical system. Verified matchday broadcasts and independent press-tracking studies consistently show that the Signal Iduna Park environment amplifies transition speed, disrupts opponent build-up routines, and compresses decision-making windows for visiting squads. The advantage is measurable when you separate crowd-generated friction from coaching-level game management. What follows is a practical breakdown of how stadium influence actually operates, how to filter promotional narratives from observable patterns, and which evaluation steps yield reliable insights for anyone tracking matchday dynamics.
Five Core Observations on Stadium Impact
Years of reviewing televised match footage, analyzing post-game broadcast breakdowns, and cross-referencing third-party tracking reports has produced a consistent pattern. The home advantage in high-capacity European stadiums does not emerge from vague excitement; it materializes through specific mechanical disruptions that traveling teams struggle to neutralize. Below are the five recurring observations that define how crowd density translates into on-field leverage.
- Acoustic interference on communication channels: Visitors frequently miss verbal cues during defensive shape transitions. Broadcast audio captures a higher rate of misdirected passes and delayed marking rotations when crowd volume spikes near touchlines and penalty areas.
- Set-piece timing compression: Defensive walls and screening routines lose synchronization under sustained auditory pressure. Teams that rely on rehearsed dead-ball positioning often revert to reactive clearing rather than controlled distribution.
- Transition acceleration for home sides: When the home team regains possession, the elevated adrenaline baseline and immediate vocal reinforcement shorten the pause between winning the ball and launching forward presses. This reduces the window for opponents to organize midfield structures.
- Referee micro-decisions leaning toward the crowd: While officials operate independently, prolonged crowd tension correlates with tighter foul thresholds near the home penalty area and faster restart enforcement. These subtle timing shifts accumulate across ninety minutes.
- Momentum carryover into late stages: Stadium energy rarely dissipates evenly. Visiting squads exhibit higher physical decay rates after sixty minutes when initial pressure strategies fail to break down organized home blocks.
A Verification Checklist for Marketing Claims
Promotional materials surrounding matchday experiences routinely inflate intangible benefits. Before accepting any claim about atmosphere-driven performance, run these verification steps against published reports, official club statements, and independent broadcast analysis.
- Check for quantified metrics: Legitimate claims cite measurable outputs such as successful press triggers, opposition pass completion drops, or defensive line displacement distances. Vague references to “electric energy” lack analytical weight.
- Validate sample size and timeframe: Single-match highlights do not establish trends. Cross-reference at least eight to ten fixtures across multiple seasons to filter out outlier performances driven by individual tactical mismatches rather than crowd dynamics.
- Separate venue design from crowd behavior: Stadium architecture influences sightlines, acoustics, and proximity to pitch edges. However, seating density, vocal coordination drills, and supporter group choreography determine actual pressure output. Confirm whether claims address both elements.
- Review opposition quality controls: A weaker visiting side facing compressed time-to-shoot metrics cannot be fairly compared against a top-tier opponent managing possession under identical atmospheric conditions. Verify whether opponent strength was normalized in the data.
- Confirm independent sourcing: Club-produced highlight reels emphasize emotional peaks. Prefer reports generated by external tracking firms, broadcast production houses, or university-affiliated sports science departments that document crowd noise alongside player biometrics.
 Hình minh hoạ: manclub
Breaking Down the Matchday Mechanics
Stadium atmosphere operates as a tactical multiplier, not a replacement for structural preparation. When crowds generate sustained acoustic layers above threshold levels, visiting coordinators face three distinct mechanical challenges. First, directional audio cues become fragmented. Players relying on hand signals or short verbal directives struggle to maintain spatial awareness during rapid phase changes. Second, reaction latency increases. Auditory overload forces defensive units to prioritize immediate scanning over pre-meditated positioning, which creates gaps between pressing lines and midfield coverages. Third, rest-and-reset protocols degrade. After conceding possession in high-pressure zones, opponents expend additional physiological resources reorganizing shape, accelerating heart-rate recovery demands beyond standard training baselines.
Home sides capitalize on these friction points through coordinated trigger actions. Midfielders hold slightly deeper drop-back positions to absorb initial pressure, while wingers maintain narrow channels to exploit delayed full-back recoveries. The result is not random chaos but calculated exploitation of disrupted communication networks. Broadcast productions frequently capture this dynamic during extended territorial spells, showing visiting players attempting to play through congested middle zones only to encounter collapsed passing lanes and rushed clearance attempts. The home team benefits because their internal signaling remains unaffected; players trained to respond to visual cues and rhythmic movement patterns retain structural integrity despite external noise.
Coaching staffs at elite venues routinely adjust warm-up routines to synchronize pre-match vocal intensity with expected crowd activation windows. Stretching sequences, positional shadow play, and set-piece rehearsals occur closer to kickoff hours when acoustic environments begin stabilizing. This deliberate pacing allows home players to calibrate hearing sensitivity and spatial orientation before competitive contact begins. Opponents arriving earlier or following standardized global travel schedules often lack this localized acoustic conditioning, creating a compounding disadvantage that intensifies as match duration progresses.

How Modern Tracking Tools Process Crowd Data
Analysts and supporter communities increasingly rely on digital platforms to map atmospheric variables against live performance shifts. Instead of estimating crowd impact through subjective commentary, tracking systems aggregate acoustic readings, camera-based movement mapping, and broadcast timestamp annotations to produce actionable overlays. These tools measure pass rejection rates, defensive line jumps, and transition delay intervals while correlating them with documented attendance density and vocal peak windows. For observers seeking transparent matchday breakdowns, aggregators like manclub provide structured data visualization layers that help cross-reference environmental pressure with statistical output trends. Such frameworks allow reviewers to distinguish between routine possession exchanges and genuine atmosphere-driven disruption cycles.
Data ingestion methods prioritize consistency over isolated spikes. Continuous microphone arrays positioned along perimeter rails record decibel progression throughout each half, while computer vision modules track player separation distances and directional velocity. When combined, these inputs generate heat maps highlighting zones where opposition decision latency exceeds acceptable thresholds. Reporters and tactical reviewers use these overlays to validate whether promotional narratives align with underlying movement metrics. The process removes guesswork from atmosphere evaluation by anchoring claims to timestamped behavioral shifts rather than retrospective storytelling.
Risk awareness remains essential when interpreting platform-generated summaries. Aggregated datasets occasionally normalize extreme events or exclude contextual factors such as weather conditions, referee assignment variations, or mid-match substitutions that alter pressure distribution. Always verify whether tracking providers disclose their sampling methodology, equipment calibration standards, and exclusion criteria. Transparent reporting enables readers to weigh environmental impact accurately without overstating correlation versus causation.

Comparison of Elite Stadium Environments
Evaluating atmosphere-driven performance requires side-by-side framing of comparable venues. The table below outlines how major European grounds differ across four measurable dimensions. Figures represent typical operational ranges observed across multi-season tracking reports and should be treated as illustrative criteria rather than fixed constants.
| Venue Dimension | Signal Iduna Park | Anfield | Camp Nou / Estadi Olímpic Lluís Companys | San Siro |
|---|---|---|---|---|
| Acoustic Density Range | High standing capacity behind goals | Concentrated terraced elevation | Variable due to temporary configurations | Distributed upper-tier projection |
| Opponent Communication Breakdown Rate | Frequent sideline miscommunication | Moderate to high central delays | Inconsistent without full standing sections | Sporadic corner-flag interruptions |
| Tactical Adaptation Window | Compressed by twenty-five percent | Reduced by eighteen percent | Fluctuates with layout changes | Minimized primarily during set pieces |
| Historical Win Differential (Non-League) | Consistent across decades | Strong in knockout formats | Declining during transitional periods | Shared impact between tenants |
These comparisons demonstrate that venue geometry, supporter distribution, and cultural vocal traditions create distinct pressure signatures. No single ground replicates another’s disruption profile, yet all follow similar mechanical pathways: communication degradation, timing compression, and physiological drain on visiting units. Evaluators should match platform metrics against these baseline behaviors before attributing match outcomes exclusively to crowd influence.

Which Teams Leverage It Effectively and Which Do Not
Atmospheric advantage functions as a force multiplier that rewards specific tactical architectures. High-press systems, vertical transitioning structures, and aggressive wide-overlap philosophies thrive in acoustically dense environments. Players conditioned to operate within compact horizontal spacing benefit from immediate vocal reinforcement during counter-initiation phases. Conversely, possession-dominant teams reliant on slow buildup circulation and methodical positional rotation often encounter structural suffocation when crowd volume restricts lateral passing corridors. These sides require specialized coping mechanisms, such as deep-lying playmaker shielding, targeted off-ball movement screens, and alternative channel deployment to bypass acoustic interference.
Managerial flexibility determines whether a squad converts stadium energy into measurable output. Coaches who implement adaptive trigger menus allow midfielders to switch between patient circulation and rapid forward bursts depending on crowd activity peaks. Those insisting on rigid pattern execution frequently encounter forced turnovers when external pressure collapses planned passing triangles. Historical performance records consistently show that tactically rigid visitors struggle more in high-density venues than flexible opponents who adjust tempo thresholds mid-game.
Supporter behavior also shapes effectiveness. Organized vocal groups that synchronize chants with press triggers generate compounded disruption. Uncoordinated cheering produces isolated spikes rather than sustained acoustic bands. Clubs that integrate supporter coordination protocols into pre-match briefing materials typically see more reliable environmental translation. Independent analysts recommend tracking chant initiation timestamps against pressing activation windows to quantify alignment success.
Practical Recommendations for Evaluation
Reviewing stadium-driven performance requires disciplined verification habits. Follow these operational steps to separate documented impact from promotional narrative.
- Establish baseline expectations: Define which metrics matter most for your analysis. Track opposition pass completion in final-third entry zones, monitor defensive line jump frequency, or log transition delay intervals. Select two primary indicators before examining match footage.
- Cross-reference broadcast timestamps: Mark moments when crowd volume visibly intensifies on-screen. Compare those markers against statistical overlays showing possession loss location, referee whistle timing, and player reaction latency.
- Filter for opponent caliber: Normalize results by adjusting for visiting team tactical identity. A low-block side facing compressed time metrics should not be equated with an open-structure team struggling under identical pressure conditions.
- Verify tracking provider transparency: Check whether reported data sources disclose equipment calibration, sampling frequency, and exclusion parameters. Prioritize platforms that publish methodology alongside results.
- Maintain bankroll and attention limits: Environmental analysis often intersects with speculative viewing habits. Set daily information intake boundaries, avoid chasing anomaly alerts, and treat all predictive frameworks as probabilistic guides rather than guaranteed outcomes. Responsible consumption preserves analytical clarity.
Frequently Asked Questions
Does crowd noise directly cause missed passes? Indirectly. Acoustic overload fragments verbal coordination, forcing players to rely on visual cues that require additional processing time. Missed connections usually result from compounded timing delays rather than single-sound events.
Can coaches completely neutralize stadium pressure? Partially. Structured communication drills, shielded playmaker roles, and adapted substitution timing reduce disruption margins. Complete neutralization remains unrealistic due to physiological response limitations under sustained acoustic load.
Are atmosphere metrics reliable for long-term predictions? They indicate probability shifts, not certainties. Environmental factors interact with injury status, refereeing assignments, and tactical surprises. Treat tracked data as one input among many rather than a standalone forecasting tool.
How do temporary stadium configurations affect reliability? Layout changes alter acoustic reflection paths and seating density distributions. Comparisons should only extend across seasons utilizing identical venue arrangements or adjusted weighting factors.
Borussia Dortmund continues to demonstrate that home atmosphere functions as a legitimate performance accelerator when matched with disciplined tactical execution and coordinated supporter integration. If your evaluation framework prioritizes timestamped behavioral metrics, cross-validated tracking sources, and structured comparison matrices, the environmental advantage delivers consistent analytical value. If you expect isolated matchdays to override fundamental tactical disparities or dismiss the need for verification checklists, the promised returns remain unreliable. Adjust your assessment approach accordingly, and the stadium impact will reveal itself through measurable patterns rather than unverified promises.